SOUL-DRIFTER
Life Long Researcher
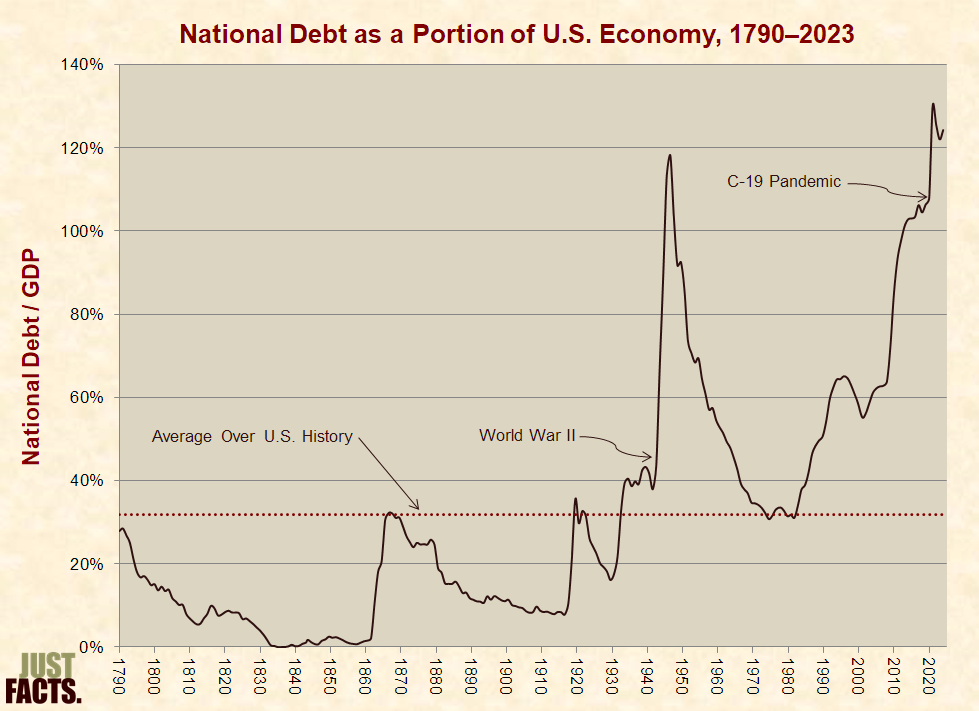
National debt is getting progressively worse and worse and if our politicians of either side do not mount a plan to get it under control it will devour our economy and the economical system will collapse.
Nobody in any political party is addressing this or trying to do anything about it.
Read and look at the data.
Social programs went from 21% of federal budget in 1960 to 63% in 2016. That same time period spending on our defense dropped from 53% down to 18%.
Can you see where this is leading just in this area?
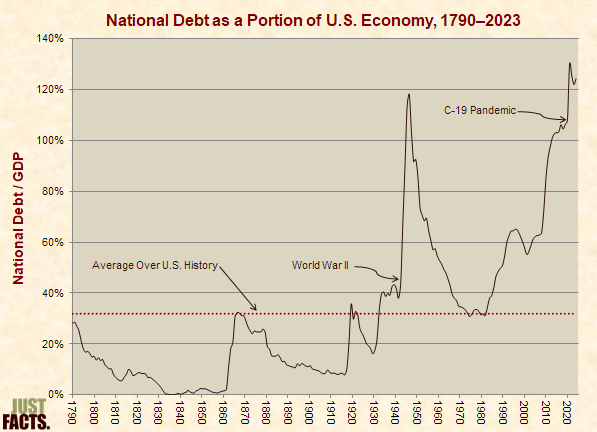
National Debt – Just Facts
U.S. National Debt Clock : Real Time
Fear of Federal Debt Has Faded, but Risks Remain
The 2017 Long-Term Budget Outlook
An Update to the Budget and Economic Outlook: 2017 to 2027
The Budget and Economic Outlook: 2017 to 2027
What does the federal government spend your tax dollars on? Social insurance programs, mostly
Nobody in any political party is addressing this or trying to do anything about it.
Read and look at the data.
Social programs went from 21% of federal budget in 1960 to 63% in 2016. That same time period spending on our defense dropped from 53% down to 18%.
Can you see where this is leading just in this area?
Publicly traded companies are legally required to account for “explicit” and “implicit” future obligations such as employee pensions and retirement benefits.[7] [8] [9] The federal budget, which is the “government’s primary financial planning and control tool,” is not bound by this rule.[10] [11]
* At the close of the federal government’s 2016 fiscal year (September 30, 2016), the federal government had roughly:
- $8.5 trillion ($8,542,000,000,000) in liabilities that are not accounted for in the publicly held national debt, such as federal employee retirement benefits, accounts payable, and environmental/disposal liabilities.[12]
- $29.0 trillion ($29,038,000,000,000) in obligations for current Social Security participants above and beyond projected revenues from their payroll and benefit taxes, certain transfers from the general fund of the U.S. Treasury, and assets of the Social Security trust fund.[13] [14]
- $32.9 trillion ($32,900,000,000,000) in obligations for current Medicare participants above and beyond projected revenues from their payroll taxes, benefit taxes, premium payments, and assets of the Medicare trust fund.[15] [16]
* The figures above are determined in a manner that approximates how publicly traded companies are required to calculate their liabilities and obligations.[17] [18] [19] The obligations for Social Security and Medicare represent how much money must be immediately placed in interest-bearing investments to cover the projected shortfalls between dedicated revenues and expenditures for all current participants in these programs (both taxpayers and beneficiaries).[20] [21] [22]
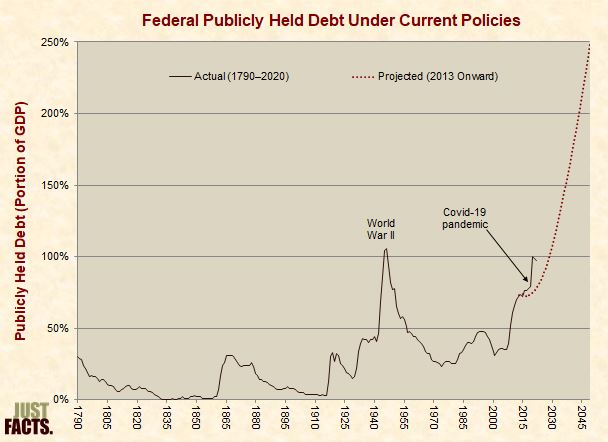
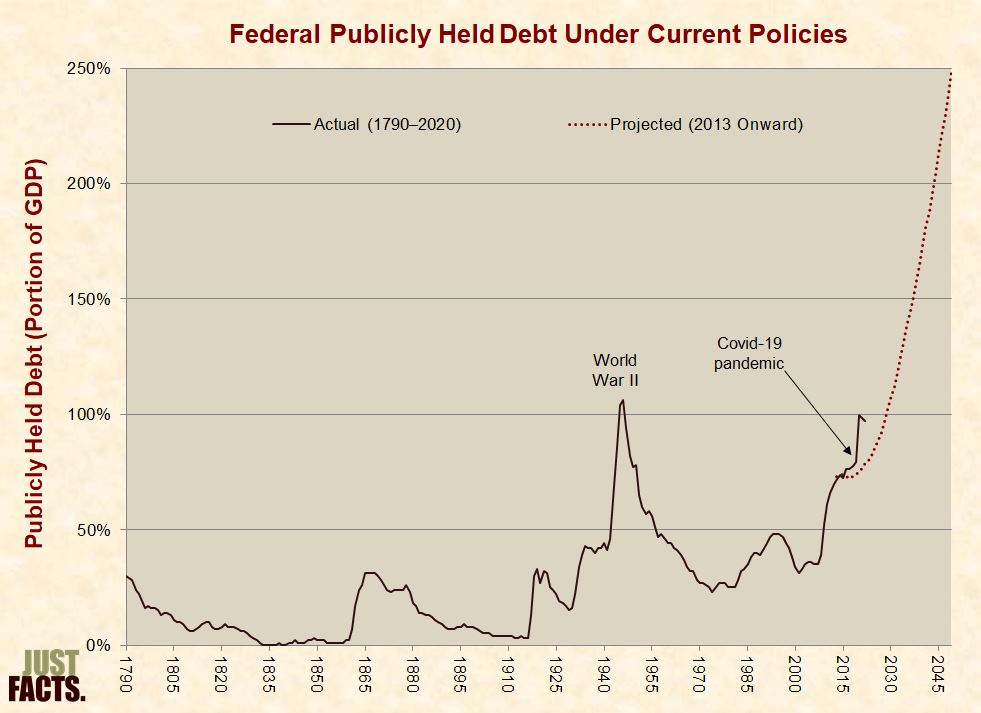
Per CBO, postponing action to stabilize the debt will:
- punish younger generations of Americans, because most of the burden would fall on them.
- reward older generations of Americans, because “they would partly or entirely avoid the policy changes needed to stabilize the debt.”
- “substantially increase the size of the policy adjustments needed to put the budget on a sustainable course.”[74] [75]
National Debt – Just Facts
U.S. National Debt Clock : Real Time
Fear of Federal Debt Has Faded, but Risks Remain
The 2017 Long-Term Budget Outlook
An Update to the Budget and Economic Outlook: 2017 to 2027
The Budget and Economic Outlook: 2017 to 2027
What does the federal government spend your tax dollars on? Social insurance programs, mostly
... In fiscal year 2016, which ended this past Sept. 30, the federal government spent just under $4 trillion, and about $2.7 trillion – more than two-thirds of the total – went for various kinds of social insurance (Social Security, Medicaid and Medicare, unemployment compensation, veterans benefits and the like).
,,,